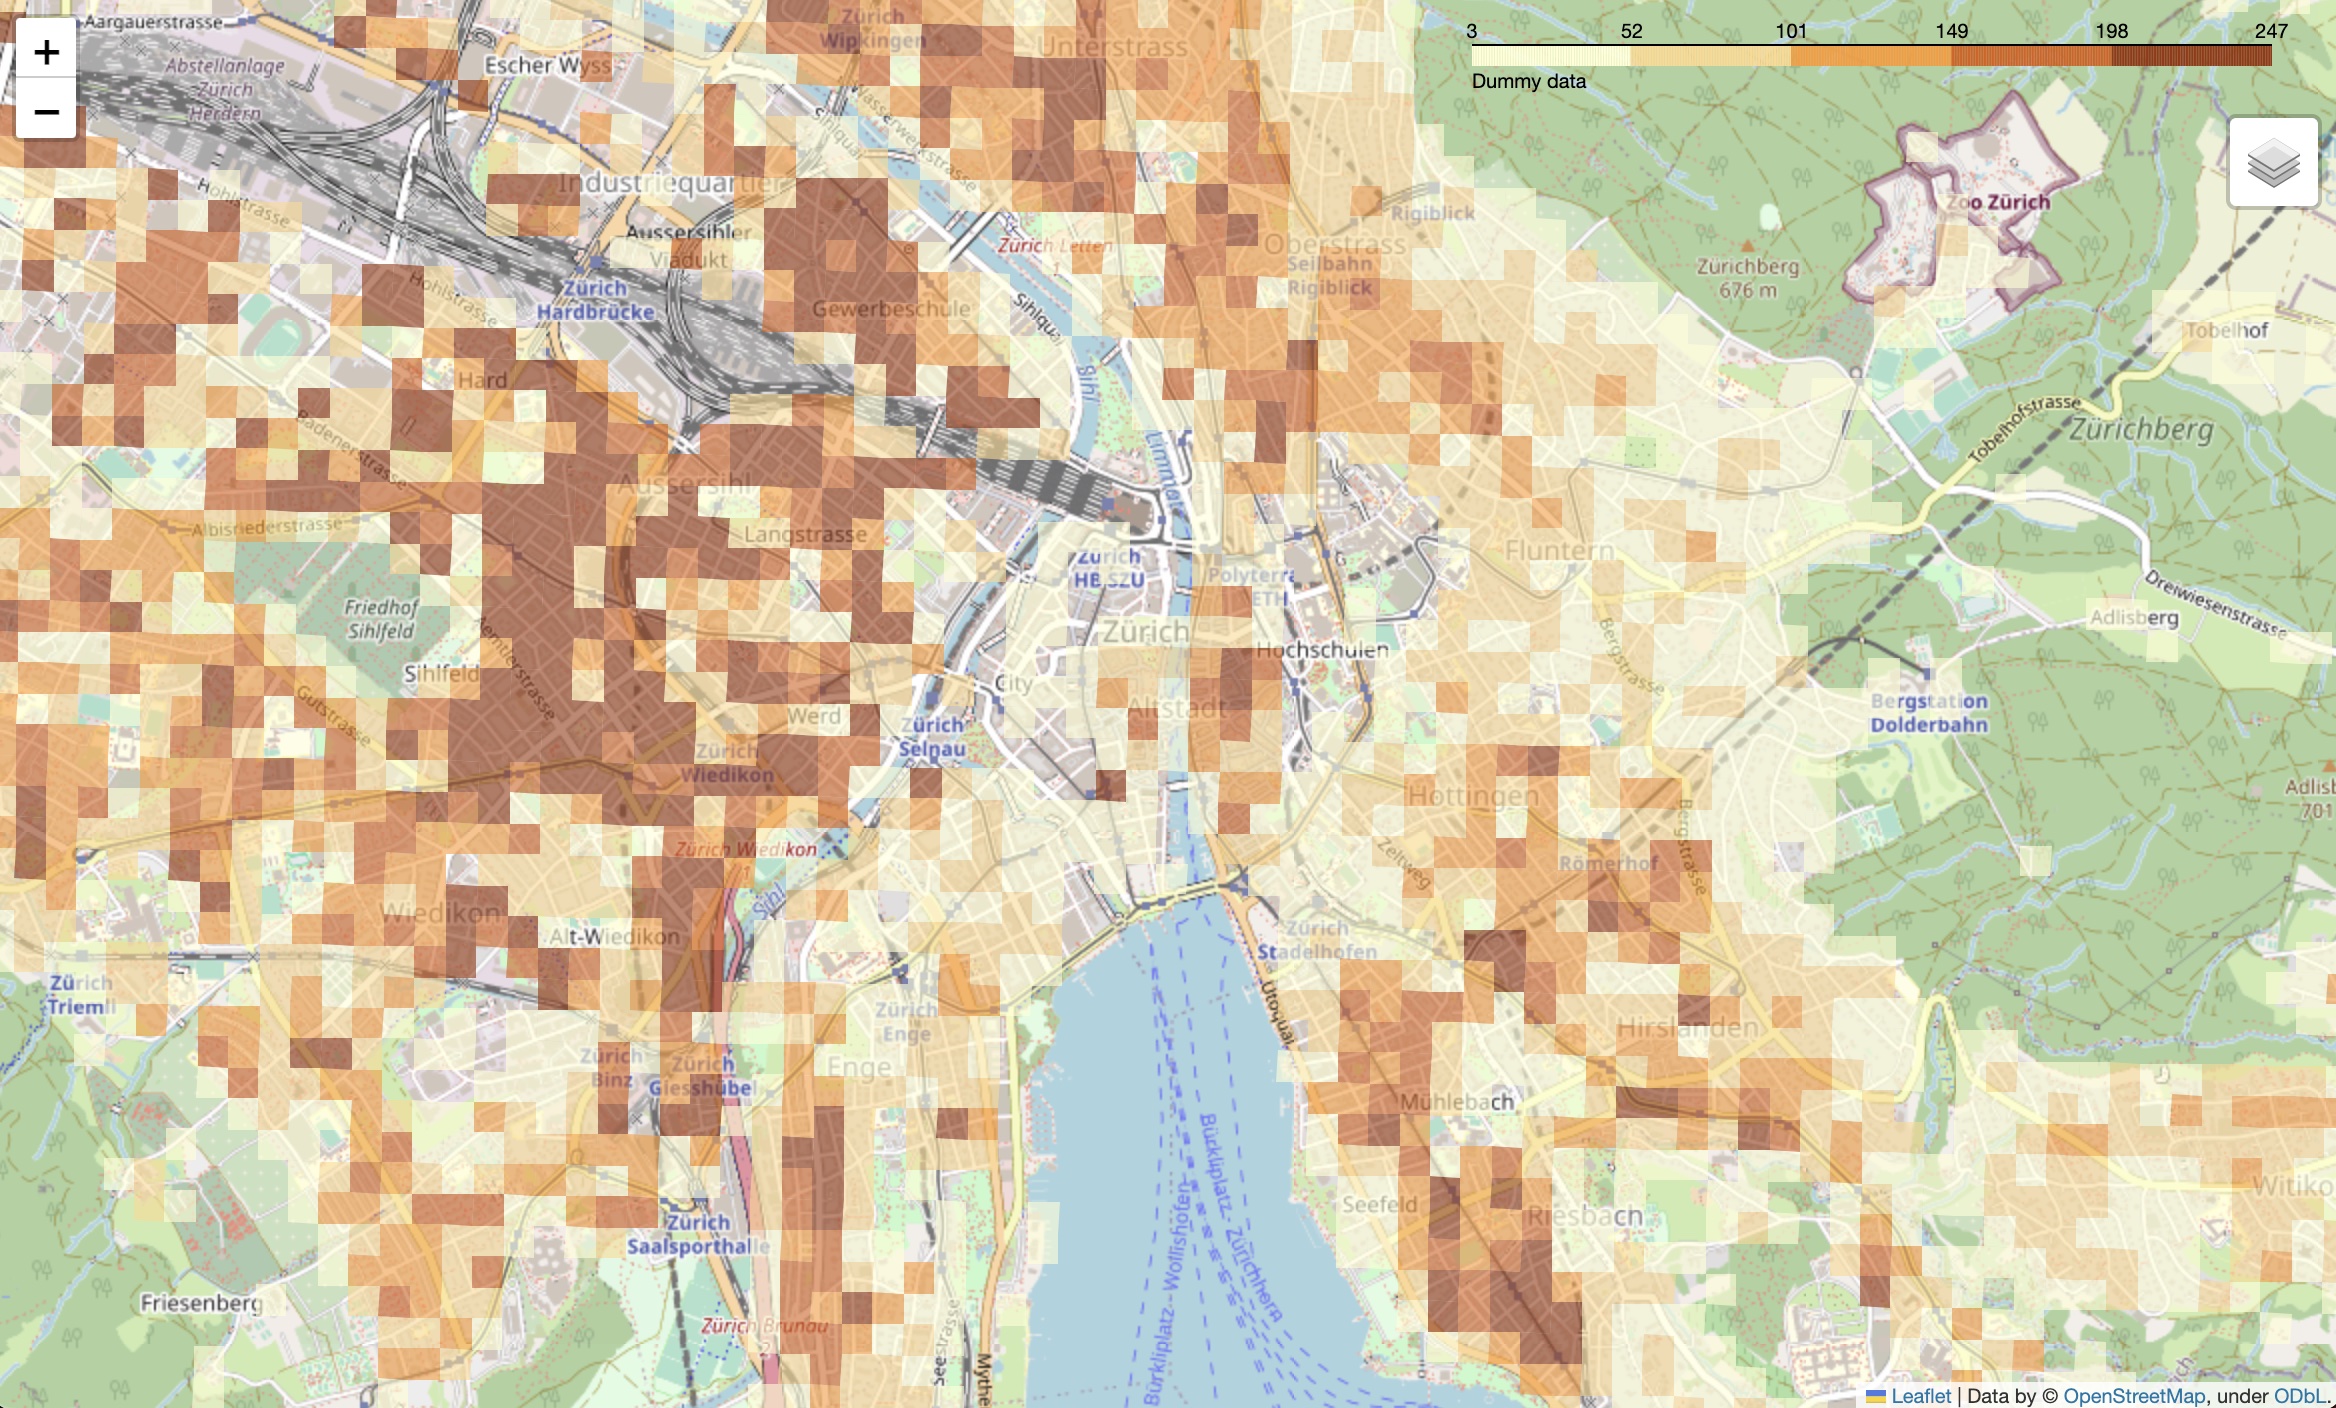
Map with statistics per hectare
Visualise geo stats in Switzerland 🇨🇭
The open-source package allows to display an interactive map with a choropleth displaying some statistics as color per hectare (100x100 meter square).

The typical use-case would be to visualise and do plausibility checks of hectare-level data as well as to compare statistics between geographic areas.
For more information, see the documentation and github repository of the project.